09:41
Sample Savings Reported by Program Users
TELUS
SAVED $300.00
Toronto, ON
Jack Astor’s Bar and Grill
SAVED $271.05
Thornhilll, ON
GoodLife Fitness
SAVED $226.00
toronto, ON
Loblaw Optical / Eyewear
SAVED $160.00
Summerside, PE
Sleep Country Canada
SAVED $100.00
Toronto, ON
Landmark Cinemas
SAVED $44.85
surrey, BC
Most Popular Perks
Cineplex Movie Tickets
SAVED $32.70
Vancouver, BC
The Source
SAVED $31.56
Ajax, ON
Apple Inc.
SAVED $30.00
Toronto, ON
By Estimated Savings
By Activity
About this Report
Estimated Spend and Estimated Savings values are based on a proprietary Venngo algorithm that leverages a number of data points. These data points include;
reported sales, redemption rates, average spend, purchase information provided directly from end-users, and the discount in market at the time redemption was activated.
These estimated values are based on your individual group activity, and corresponding aggregated vendor data.
Average spend is based on information provided by individual vendors, information submitted by end-users and specific market research. Venngo continually reviews and
updates all estimated spend, average spend and savings data.
Activity and Estimated Savings
November 1, 2016 to November 30, 2016
Please note: For vendor programs that provide recurring monthly savings (i.e. cellular phone offers, insurance, etc.) the goal of the report is to capture the aggregated
spend and savings — from all end-users actively utilizing the offer — to accurately reflect the total value of the vendor offer within your group. We are working with each of
our vendors to gather complete utilization data. Until vendor data has been updated, the spend and savings for these vendor offers will be calculated solely on the activity
within the date range of the report and will therefore be underreported. Vendor programs that have been updated to include the aggregated utilization data will be noted
with a ‡.
Estimated
Total Monthly
Spend $3,878,599 Estimated
Total Monthly
Savings $1,050,400
† Within the reported timeframe, the activity for this specific vendor within your program was not high enough to generate the minimum number of redemption clicks needed
to statistically complete one full redemption. As a result, the report is displaying only a fraction of the total savings that can be realized when an end-user actually redeems
this vendor's discount. While this scenario can occur with any vendor program it will typically present itself with products or services that are high in dollar value as they
typically have lower redemption rates. For example, while one hundred end-users may click-through to the redemption for a car discount, only a small fraction (i.e. 1/100) of
those end-users will actually purchase a vehicle. This ratio is factored into the algorithm on a per vendor basis.
Legend
Activity data captured from end-users using web browsers on desktop and mobile devices.
Activity data captured from end-users on the Venngo mobile apps. This does not include activity data captured from web browsers used on mobile devices.
e-Newsletter click-through rate. This number notes the percentage of end-users who clicked on a link to a vendor program from an opened e-Newsletter.
The total number of e-Newsletters that were opened
Most Popular Categories Page Views
1 Computers & Electronics 34,145
program.
individual page views.
active in the been number of have end-users Views is the total number of times mobile app. Page The total within the or Visits reloaded) in a browser loaded (or instance of a page being Page View is an A Page Views Redemption
Clicks
A redemption click is the final action that an end-user takes within the program to access the discount with a specific vendor. A redemption click includes the following program
actions; printing a perk, accessing the vendor website (WWW link), using the in-store option within the mobile apps, calling a vendor or sending an email.
e-Newsletters
Sent
The total number of e-Newsletters delivered to the group. Each month multiple e-Newsletter campaigns are distributed to the group. Each campaign will have specific
subscribers which may not include the entire group as noted in e-Newsletter Subscriptions. For example, an end-user who is subscribed to the general e-Newsletter
distribution may have decided that they do not wish to receive the apparel edition. This factor, along with any technical or end-user specific account issues will result in the total
number of e-Newsletters Sent to not simply be a multiple of e-Newsletter Subscribers.
CONFIDENTIAL — Venngo Inc.
Activity and Estimated Savings November 1, 2016 to November 30, 2016
CONFIDENTIAL — Venngo Inc.
Estimated
Spend ($)
Estimated
Savings ($)
1 TELUS $1,953,500 $586,050
2 GoodLife Fitness $338,400 $169,200
3 Rogers Wireless $558,012 $167,797
4
TicketsAtWork.com- Discounts
Worldwide $36,600 $10,980
5 Lenovo $42,552 $8,510
6 Budget $33,408 $8,352
7 Hertz $22,968 $6,890
8 Panasonic Canada $13,312 $5,991
9 Apple Inc. $193,620 $5,809
10 Avis $22,764 $5,691
11
Nissan Canada's Vehicle Purchase
Program $101,120 $5,056
12 Dell Canada $43,280 $4,328
13 The Source $27,000 $4,050
14 Wyndham Hotel Group $17,680 $3,536
15 Choice Hotels Canada $14,100 $2,820
16
Medieval Times Dinner and
Tournament $7,453 $2,757
17 Orlando Vacation $16,950 $2,542
18 Enterprise Rent-A-Car™ $10,509 $2,102
19 Loblaw Optical / Eyewear $4,620 $1,848
20 Canada Employee Sleep Program $3,290 $1,810
21 Ripley's Aquarium $9,480 $1,659
22 GM Preferred Pricing† $32,000 $1,600
23 itravel2000 $44,465 $1,410
24 adidas $5,521 $1,380
25 Cineplex Movie Tickets $7,830 $1,331
Redemption
Clicks
Page
Views
1 TELUS 14,046 31,153
2 Rogers Wireless 5,471 10,707
3 Apple Inc. 3,227 7,622
4 GoodLife Fitness 423 2,685
5 Dell Canada 1,082 2,644
6 Lenovo 1,182 2,356
7 The Source 900 2,157
8 Cineplex Movie Tickets 522 1,738
9 adidas 516 1,720
10 LXR&CO 341 1,524
11 Enterprise Rent-A-Car™ 513 1,479
12 SoftMoc 479 1,422
13 Choice Hotels Canada 564 1,305
14 Budget 464 1,172
15 BCBGMAXAZRIA Canada 65 1,122
16 Raptors 905 172 1,055
17 Starfrit 158 983
18 Jack Astor’s Bar and Grill 337 910
19 Panasonic Canada 355 868
20 itravel2000 376 853
21 La Vie en Rose 312 848
22
TicketsAtWork.com- Discounts
Worldwide 305 800
23 Flight Network 299 796
24 Ripley's Aquarium 316 785
25 Hertz 319 782
Accounts Created
669
Total Active Accounts
54,098
e-Newsletter Subscriptions
41,995
Visits
31,676
96% 4%
Page Views
304,613
97% 3%
Redemption Clicks
39,961
81% 19%
e-Newsletters Sent
111,244
54,028 15%
CONFIDENTIAL — Venngo Inc.
31,086 3,059
2 Dining & Food 8,917
5,263 3,654
3 Travel 8,674
7,102 1,572
4 Apparel 8,481
5,778 2,703
5 Entertainment 5,114
3,713 1,401
6 Auto 4,146
3,169 977
7 Shoes & Accessories 3,351
2,448 903
8 Health & Wellness 3,330
2,544 786
9 Home & Living 2,982
2,339 643
10 Beauty 2,356
1,587 769
the original perks companyTM
the original perks companyTM
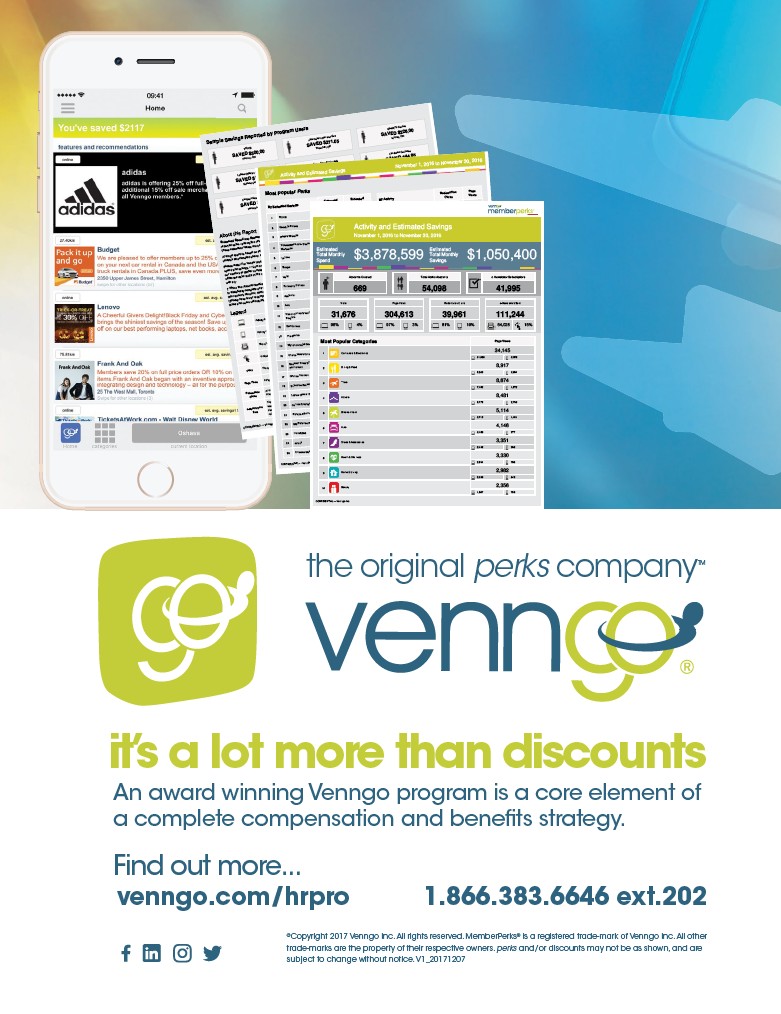
it’s a lot more than discounts
An award winning Venngo program is a core element of
a complete compensation and benefi tsstrategy.
Find out more...
venngo.com/hrpro 1.866.383.6646 ext.202
©Copyright 2017 Venngo Inc. All rights reserved. MemberPerks® is a registered trade-mark of Venngo Inc. All other
trade-marks are the property of their respective owners. perks and/or discounts may not be as shown, and are
subject to change without notice. V1_20171207
/TicketsAtWork.com
/TicketsAtWork.com
/hrpro